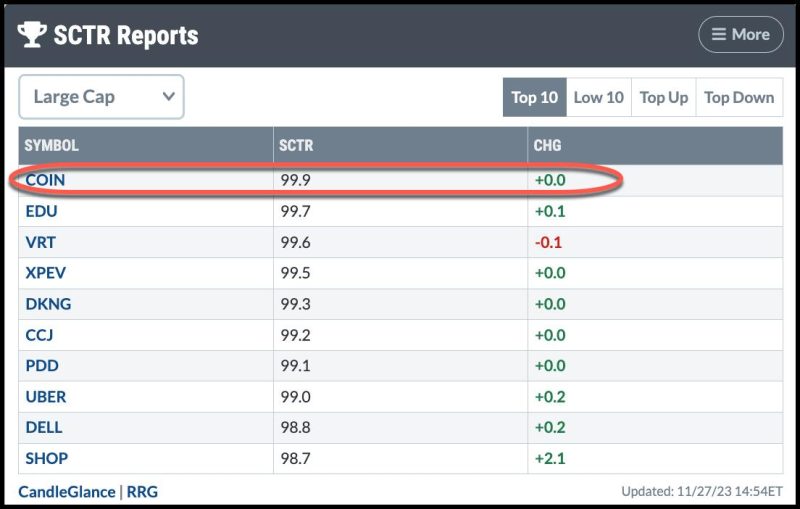
The cryptocurrency space has had its share of challenges, but Coinbase (COIN) looks like it may be setting itself apart from the pack, especially after its last earnings report on November 2. COIN’s stock price is up over 200% this year and it made it to the top position in the StockCharts Technical Rank (SCTR) score.
CHART 1: STOCKCHARTS TECHNICAL RANKING (SCTR). COIN made it to #1 position in the Top 10, Large Cap category.Chart source: StockCharts.com. For educational purposes.
In the weekly chart of COIN below, you can see that the stock has broken above its August 2022 and July 2023 highs. The stock is trading above its 50-day simple moving average (SMA). If COIN continues moving higher, there’s not too much in terms of resistance. Remember, however, that the stock started trading in April 2021, so it’s not going to have too many significant support and resistance levels, especially in a weekly chart. But it’s still a good stock to add to your ChartLists, especially if Bitcoin and other cryptocurrencies set up for a bullish rally.
CHART 2: WEEKLY CHART OF COINBASE STOCK PRICE. The stock has broken above its more recent highs. It remains to be seen if the breakout has some follow-through.Chart source: StockCharts.com. For educational purposes.
Let’s switch to the daily chart to see more granularity in COIN (see chart below).
CHART 3: DAILY CHART OF COIN STOCK PRICE. The stock’s trend is correlated with the trend in cryptocurrencies. A SCTR score of 99.9 and RSI of 85 could mean the stock is overbought. Look for a pullback followed by a reversal to the upside.Chart source: StockCharts.com. For educational purposes.
With a SCTR score of 99.9 and a relative strength index (RSI) of 85, there’s a chance the stock is overbought. A pullback followed by a pivot reversal with strong upside momentum would be a good reason to add the stock to your portfolio. Since it’s a risky play, given the volatility in cryptocurrency, place a tight stop if you enter a long position.
The price of COIN stock moves in sync with the crypto market. If crypto sees strong performance by Coinbase’s next earnings date on February 20, COIN’s stock price could move higher. But keep your ears open for news on the regulatory front. Any regulatory threats could send crypto prices lower, fast.
What’s the Significance of the SCTR Score?
In a nutshell, SCTR is a numerical score that ranges from 1 to 100. The higher the value, the higher the stock’s rank. To get a high SCTR rank, a stock or ETF should score high with all the indicators used to calculate the SCTR score and in the short, medium, and long-term time frames.
The SCTR score identifies the leaders and laggards within specific industry groups. Since the calculations are done for you, all you have to do is add the indicator panel on SharpCharts or StockChartsACP.
How To Add the SCTR Line to Your Charts
In the SharpCharts Workbench, from the Indicators dropdown menu, click SCTR Line.In StockChartsACP, click on SCTR Line from the Standard Indicators list.
Disclaimer: This blog is for educational purposes only and should not be construed as financial advice. The ideas and strategies should never be used without first assessing your own personal and financial situation, or without consulting a financial professional.
